Java promises “write once, run anywhere,” but that’s marketing. The real engine is the JVM—a runtime operating system that transforms bytecode into machine execution, manages memory, and optimizes hot paths on the fly. It’s not just an interpreter. It’s a sophisticated runtime that competes with native compiled languages by making smart trade-offs between startup speed and steady-state performance. Understanding how it works reveals why Java remains a dominant choice for large-scale systems despite decades of competition from Go, Node.js, and Rust.
JVM as a Runtime Operating System
Think of the JVM as an OS within your OS. Just as an operating system manages processes, memory, and threads for native applications, the JVM does the same for Java programs—but at the bytecode level. It provides isolation, memory management, thread scheduling, and I/O abstractions. Your Java code never touches hardware directly; the JVM mediates every interaction.
The execution flow is straightforward:
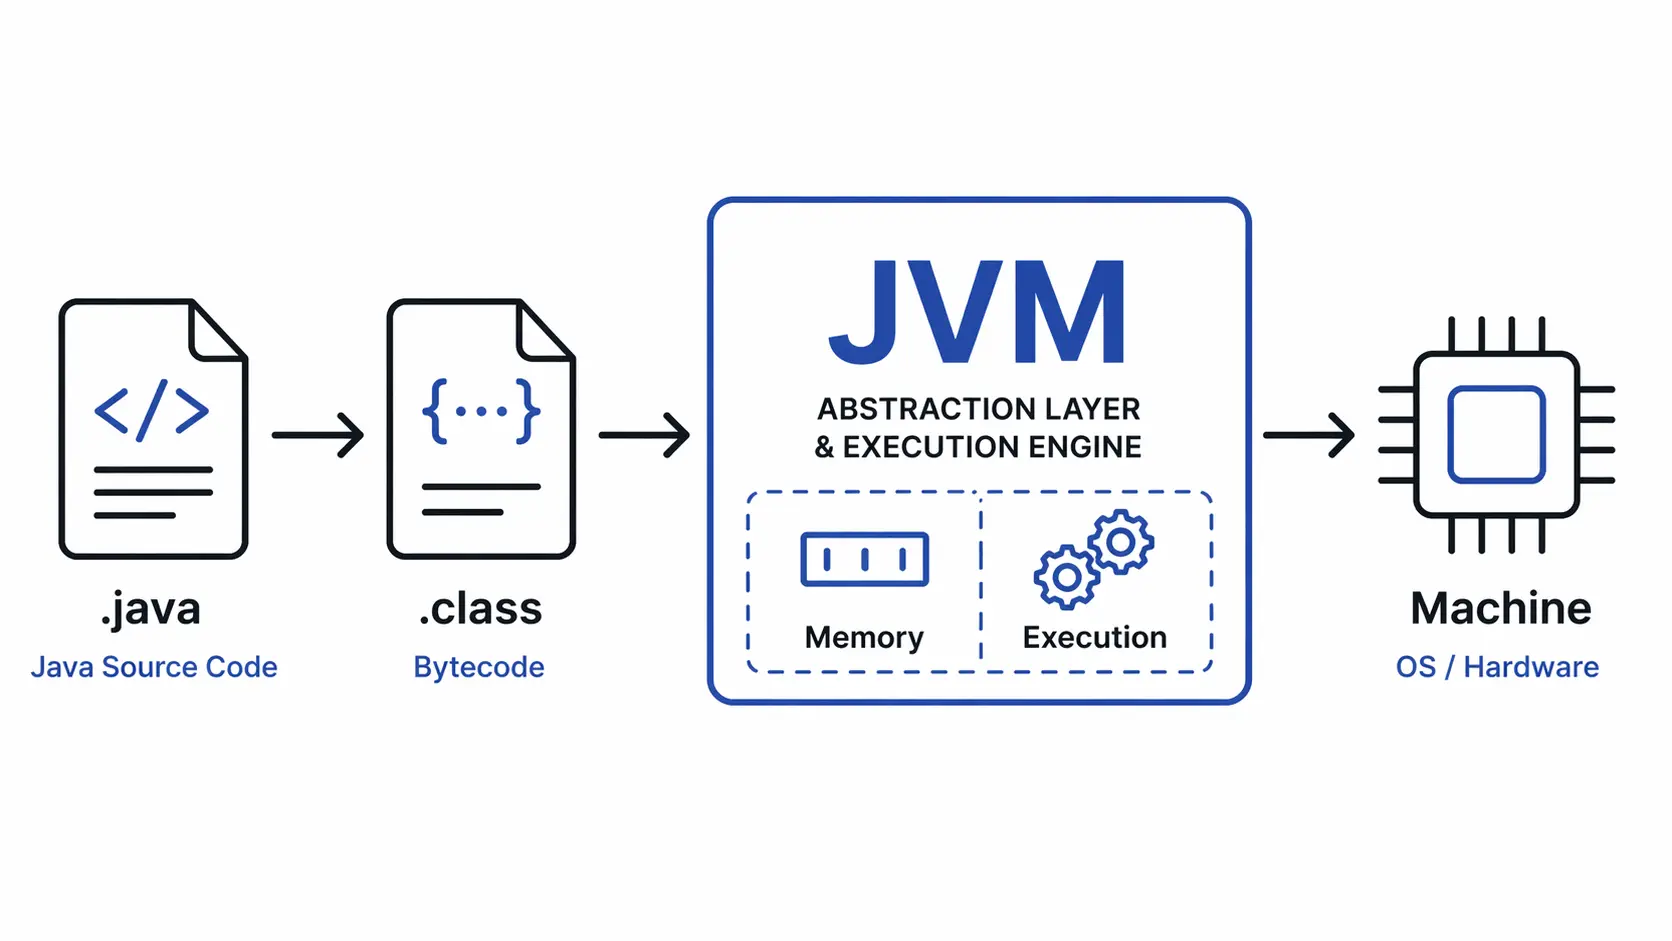
.java (source) → javac (compiler) → .class (bytecode) → JVM → machine execution
The compiler (javac) translates human-readable Java into platform-independent bytecode. The JVM then takes over, loading classes, allocating memory, and executing instructions. This separation is what enables portability: the same .class file runs on Windows, Linux, and macOS without recompilation.
graph LR
    A[Source Code .java] --> B[javac Compiler]
    B --> C[Bytecode .class]
    C --> D[Class Loader]
    D --> E[Runtime Memory]
    E --> F[Execution Engine]
    F --> G[Native Machine Code]
Class Loading: Lazy and Hierarchical
The JVM doesn’t load every class upfront. It’s lazy. Classes are loaded on demand—the first time they’re referenced by name, field access, method invocation, or instantiation. This keeps startup fast and memory usage low, especially critical for large applications with thousands of classes.
Class loading follows a three-tier hierarchy:
- Bootstrap ClassLoader – Written in native code, loads core Java classes (
java.lang.*,java.util.*). This is the root of the hierarchy. - Platform ClassLoader – Loads platform-specific extensions and modules (Java 9+ modular system).
- Application ClassLoader – Loads your application classes and third-party libraries from the classpath.
Delegation model:
When a class is requested, the application loader first delegates to its parent (platform), which delegates to the bootstrap loader. Only if the parent can’t find the class does the child attempt to load it. This ensures core classes are always loaded by the bootstrap loader, preventing malicious code from replacing java.lang.String.
Why this matters:
Lazy loading means faster startup, but it also means class-loading errors (ClassNotFoundException, NoClassDefFoundError) can surface at runtime, not compile time. Understanding the hierarchy helps debug classpath issues and security boundaries—custom loaders can isolate modules, implement hot-reloading, or enforce security policies.
Runtime Memory Layout: Where Everything Lives
The JVM divides memory into distinct regions, each with specific purposes and lifecycle rules. These regions determine how data is allocated, accessed, and collected.
graph TD
    A[JVM Runtime Memory] --> B[Heap]
    A --> C[Stack Per Thread]
    A --> D[Metaspace]
    A --> E[Program Counter]
    A --> F[Native Method Stack]

    B --> G[Young Generation]
    B --> H[Old Generation]
    G --> I[Eden Space]
    G --> J[Survivor Space]

    C --> K[Stack Frame]
    K --> L[Local Variables]
    K --> M[Operand Stack]
    K --> N[Frame Data]
Heap: Where Objects Live
The heap is the largest memory region, shared across all threads. Every object instance and array is allocated here. Heap memory is divided into generational spaces to optimize garbage collection:
- Young Generation – Newly created objects start here. Most objects die young (short-lived), so this space is collected frequently.
- Eden Space – New objects are allocated here first.
- Survivor Spaces (S0, S1) – Objects that survive one collection are promoted to a survivor space.
- Old Generation (Tenured) – Objects that survive multiple garbage collections are promoted here. This space is collected less frequently but takes longer to clean.
Why generational? Empirical observation shows most objects die young. By segregating young objects and collecting them frequently with fast algorithms, the JVM minimizes pause times. Long-lived objects migrate to the old generation, where expensive, thorough collections happen less often.
Stack: Per-Thread Execution Context
Each thread gets its own stack, storing execution state in stack frames. When a method is called, a new frame is pushed onto the stack:
- Local variables – Method parameters and local variables.
- Operand stack – A workspace for bytecode instructions (push, pop, arithmetic).
- Frame data – Return address, exception handlers, references to the runtime constant pool.
When the method returns, the frame is popped, and control returns to the caller. Stack memory is automatically managed—no manual allocation or deallocation. But stacks are limited in size (typically 1MB per thread), so deep recursion or large local arrays can cause a StackOverflowError.
Metaspace: Class Metadata
Before Java 8, class metadata lived in the PermGen (Permanent Generation), a fixed-size heap region. This caused OutOfMemoryError: PermGen space when too many classes were loaded (common in dynamic frameworks like Spring).
Java 8 replaced PermGen with Metaspace, which uses native memory (off-heap). It grows dynamically as classes are loaded, bounded only by available system memory. This eliminated a major pain point for applications with heavy class-loading (e.g., application servers, OSGi containers).
Program Counter and Native Method Stack
- Program Counter (PC Register) – Each thread has a PC register holding the address of the current bytecode instruction. For native methods, it’s undefined.
- Native Method Stack – Stores state for native methods (written in C/C++ via JNI). This is where JVM calls into native libraries like file I/O, networking, or graphics.
Execution Engine: From Interpretation to Native Code
The JVM doesn’t just interpret bytecode line by line. It starts that way for speed, then optimizes hot paths into native machine code. This hybrid approach—interpret first, compile later—gives the JVM its performance edge.
Interpreter: Fast Startup
When a method is first called, the interpreter executes it instruction by instruction. Bytecode is already optimized for interpretation (stack-based, simple instructions), so this is fast enough for cold code. The interpreter keeps startup times low, which is why Java applications launch quickly compared to ahead-of-time (AOT) compiled languages.
JIT Compiler: Runtime Optimization
The JVM profiles code as it runs. When a method becomes “hot”—executed frequently or in a tight loop—the Just-In-Time (JIT) compiler kicks in. It compiles the bytecode into native machine code, heavily optimized for the current CPU architecture.
HotSpot optimization techniques:
- Inlining – Replace method calls with the method body to eliminate call overhead.
- Dead code elimination – Remove unreachable or unused code paths.
- Escape analysis – Allocate objects on the stack if they don’t escape the method, avoiding heap allocation and GC pressure.
- Loop unrolling – Expand loops to reduce branching.
- Speculative optimization – Make assumptions (e.g., a type is always
String) and optimize aggressively. If the assumption breaks, deoptimize and fall back to the interpreter.
Why this matters: After warmup, JIT-compiled code can outperform ahead-of-time compiled languages like C++ in some scenarios because the JIT optimizes based on actual runtime behavior, not static analysis. It knows which branches are taken, which types are used, and which methods are hot—information unavailable to a static compiler.
Tiered compilation: Modern JVMs use tiered compilation (C1 + C2):
- C1 (Client Compiler) – Quick, lightweight compilation for moderately hot methods.
- C2 (Server Compiler) – Aggressive, expensive optimizations for very hot methods.
This balances startup speed with peak performance.
Garbage Collection: Automatic Memory Management
Java developers don’t call free(). The garbage collector (GC) automatically reclaims memory from dead objects. But “automatic” doesn’t mean “free”—GC introduces pauses, latency, and complexity. Understanding how it works is critical for tuning performance.
Generational Collection Strategy
GC exploits the generational hypothesis: most objects die young. The heap is divided into young and old generations, each collected differently:
- Minor GC – Collects the young generation frequently (milliseconds). Fast because most objects are already dead.
- Major GC (Full GC) – Collects the entire heap (young + old). Slower and causes longer pauses.
How minor GC works:
- New objects are allocated in Eden.
- When Eden fills, a minor GC triggers.
- Live objects are copied to a survivor space (S0 or S1).
- Objects that survive multiple collections are promoted to the old generation.
- Eden and the previous survivor space are cleared.
This copy-based approach is fast because it only touches live objects, not dead ones.
Common GC Algorithms
- Serial GC – Single-threaded, simple. Used for small applications or low-memory environments.
- Parallel GC – Multi-threaded minor/major GC. Optimizes throughput (total work done) at the cost of longer pauses.
- G1 GC (Garbage-First) – Region-based collector that divides the heap into small regions and collects the regions with the most garbage first. Balances throughput and latency. Default in Java 9+.
- ZGC / Shenandoah – Low-latency collectors that aim for pause times under 10ms, even with multi-gigabyte heaps. Trade throughput for predictable latency.
Trade-offs:
- Throughput vs. Latency – Parallel GC maximizes throughput but causes long pauses. G1/ZGC minimize pauses but may reduce total throughput.
- Heap size – Larger heaps reduce GC frequency but increase pause times. Smaller heaps increase GC frequency but keep pauses short.
Tuning flags:
# Use G1 GC with 4GB max heap, 1GB initial heap
java -XX:+UseG1GC -Xmx4g -Xms1g -jar app.jar

# ZGC for ultra-low latency
java -XX:+UseZGC -Xmx8g -jar app.jar
End-to-End Execution Flow: A Real Scenario
Let’s trace what happens when a user hits an API endpoint in a Spring Boot application.
Request arrives: GET /api/users/123
- Class Loading
- On first request, Spring loads
UserController.class,UserService.class,User.classvia the application class loader. - These classes are parsed, verified (bytecode integrity checks), and metadata is stored in Metaspace.
- On first request, Spring loads
- Object Creation in Heap
new User(123, "Alice")allocates an object in Eden space.- Fields (
id,name) are initialized, and a reference is placed on the stack.
- Method Execution on Stack
getUserById(123)is called, creating a stack frame on the current thread’s stack.- Local variables (
userId,user) live in the frame’s local variable array. - The operand stack handles intermediate calculations (e.g.,
userId == 123).
- JIT Optimization
- If this endpoint is hit frequently, the JIT compiler notices
getUserByIdis hot. - It compiles the method to native code, inlines small methods, and optimizes database query preparation.
- If this endpoint is hit frequently, the JIT compiler notices
- Garbage Collection
- After the response is sent, the
Userobject is no longer referenced. - The next minor GC finds it dead and reclaims the memory.
- If the endpoint is called 1000 times/sec, short-lived objects create significant GC pressure—understanding this leads to object pooling or reduced allocations.
- After the response is sent, the
sequenceDiagram
    participant Client
    participant JVM as JVM / Spring Boot
    participant Loader as Class Loader
    participant Heap
    participant Stack as Thread Stack
    participant JIT
    participant GC as Garbage Collector

    Client->>JVM: GET /api/users/123
    JVM->>Loader: Load UserController.class (if not loaded)
    Loader->>Heap: Store class metadata in Metaspace
    JVM->>Heap: Allocate User object in Eden
    JVM->>Stack: Push getUserById() frame
    Stack->>Stack: Execute method (local vars, operand stack)

    alt Method is hot
        Stack->>JIT: Profile shows high invocation count
        JIT->>JIT: Compile to native code
    end

    Stack->>JVM: Return response
    JVM->>Client: 200 OK (User data)

    Note over Heap,GC: User object no longer referenced
    GC->>Heap: Minor GC triggered (Eden full)
    GC->>Heap: Reclaim User object memory
Common Misconceptions
“JVM is slow”
False. The JVM is slower at startup (class loading, interpreter), but after warmup, JIT-compiled code rivals or beats statically compiled languages. Benchmarks show Java matching C++ performance in CPU-bound tasks once the JIT optimizes hot paths.
“Java is interpreted only”
False. Java starts with interpretation but switches to native compilation for hot code. Modern JVMs spend most execution time in JIT-compiled native code, not the interpreter.
“Memory leaks don’t happen in Java”
False. Garbage collection only reclaims unreachable objects. If you hold references (e.g., in a static collection, listener registry, or cache), objects stay alive indefinitely, leaking memory. Tools like heap dumps and profilers are essential for diagnosing leaks.
Why JVM Still Matters in 2026
The JVM is one of the most battle-tested runtimes in existence. It powers enterprise systems, financial platforms, and high-throughput services because it delivers:
- Predictable performance under load – JIT optimization and tunable GC let teams balance latency and throughput.
- Mature ecosystem – Decades of libraries, frameworks, and tooling (Spring, Hibernate, Kafka, Elasticsearch).
- Cross-platform portability – One codebase runs on any OS without recompilation.
- Polyglot runtime – Kotlin, Scala, Groovy, Clojure all run on the JVM, sharing libraries and tooling.
Comparison with other runtimes:
| Runtime | Startup | Peak Performance | GC Pauses | Memory Overhead |
|---|---|---|---|---|
| JVM | Slow | Excellent | Tunable | High |
| Node.js | Fast | Good | Minimal | Medium |
| Go | Very Fast | Good | Minimal | Low |
| Native (C/Rust) | Instant | Excellent | None | Minimal |
The JVM trades startup speed and memory overhead for peak performance and safety. For long-running services where steady-state throughput matters more than cold start, this trade-off wins.
Closing Thoughts
The JVM is more than a bytecode interpreter—it’s a runtime operating system that manages memory, optimizes execution, and adapts to workload patterns. Its design reflects decades of research into performance, portability, and safety. While newer runtimes like Node.js and Go offer faster startup and lower memory footprints, the JVM remains the gold standard for high-throughput, long-running services where peak performance and ecosystem maturity matter most. Understanding how it works—from class loading to GC to JIT—gives you the knowledge to tune, debug, and architect systems that scale.
Questions
- Why does the JVM use a generational garbage collection strategy instead of collecting the entire heap at once?
- How does JIT compilation allow Java to match or exceed the performance of statically compiled languages in some scenarios?